/ concrete / mix design
The successful pumping of concrete is dependent on a number of factors including having a suitable concrete mix. Fine, naturally rounded sand is ideal for producing pumpable concrete, but as the supply of fine, naturally rounded sand decreases, concrete producers are forced to utilize materials such as manufactured sands that are often coarse, angular, and gap-graded. Use of these materials can lead to segregation while pumping, and increased pump pressure. The fundamental reason coarse angular sands do not perform as well as naturally-rounded sand is due to their inability to “flow” within the concrete matrix.
V-MAR® 3 has a unique polymeric structure that, under the influence of energy (e.g. vibration or pumping), aligns itself and allows coarse angular sand to flow similarly to naturally-rounded sand. At this point the polymers slide over each other in the direction of flow and reduce the yield stress of the concrete, essentially lubricating the pump hose, reducing internal friction, and reducing the pressure necessary to pump the concrete. As energy is removed, the polymers interlock leaving the concrete as it was before movement. V-MAR® 3 has been shown to have a neutral effect on most concrete properties, as evidenced by the setting time, air entrainment, and compressive strength data in Table 1 below.
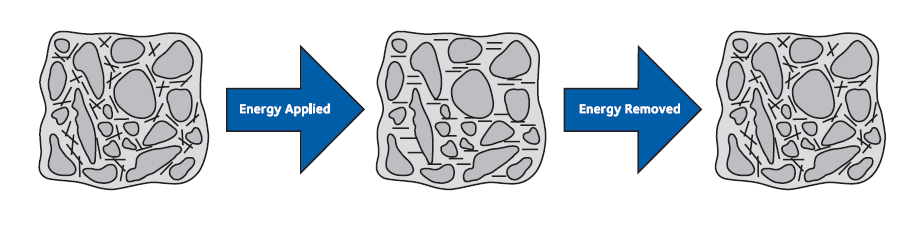
Table 1 – Neutral Effect of V-MAR 3 on Concrete Properties (SI Units)
| Cement, kg/m3 | 335 | 335 | 335 | 335 | 335 |
| Stone, kg/m3 | 798 | 798 | 798 | 798 | 798 |
| Total Sand, kg/m3 | 1026 | 1026 | 1026 | 1026 | 1026 |
| Total Mix Water, kg/m3 | 193 | 193 | 193 | 193 | 193 |
| HRWR Admixture, mL/100 kg | 300 | 300 | 300 | 300 | 300 |
| V-MAR 3, mL/100 kg | — | 60 | 110 | 170 | 220 |
| Air, % | 1.1 | 1.5 | 1.3 | 1.4 | 1.6 |
| Initial Set, hrs:min | 4:10 | 3:55 | 4:10 | 4:15 | 4:25 |
| Compressive Strength @ 1 Day, MPa | 11.0 | 10.3 | 10.9 | 10.9 | 10.8 |
| Compressive Strength @ 7 Days, MPa | 24.5 | 25.4 | 24.9 | 26.3 | 27.9 |
| Compressive Strength @ 28 Days, MPa | 31.2 | 32.7 | 32.5 | 33.1 | 35.6 |
Table 1 – Neutral Effect of V-MAR 3 on Concrete Properties (English Units)
| Cement, lb/yd3 | 564 | 564 | 564 | 564 | 564 |
| Stone, lb/yd3 | 1345 | 1345 | 1345 | 1345 | 1345 |
| Total Sand, lb/yd3 | 1730 | 1730 | 1730 | 1730 | 1730 |
| Total Mix Water, lb/yd3 | 325 | 325 | 325 | 325 | 325 |
| HRWR Admixture, oz/cwt | 4.6 | 4.6 | 4.6 | 4.6 | 4.6 |
| V-MAR 3, oz/cwt | — | 0.9 | 1.7 | 2.6 | 3.4 |
| Air, % | 1.1 | 1.5 | 1.3 | 1.4 | 1.6 |
| Initial Set, hrs:min | 4:10 | 3:55 | 4:10 | 4:15 | 4:25 |
| Compressive Strength @ 1 Day, lb/in.2 | 1600 | 1500 | 1580 | 1580 | 1560 |
| Compressive Strength @ 7 Days, lb/in.2 | 3560 | 3680 | 3610 | 3820 | 4040 |
| Compressive Strength @ 28 Days, lb/in.2 | 4530 | 4740 | 4720 | 4800 | 5170 |
The following examples show how the incorporation of manufactured sand in pumped concrete was made possible by utilizing V-MAR® 3 as a pumping aid. The addition of V-MAR® 3 to the concretes led to pump pressures being maintained at levels equal to or below the pressures produced by the control concrete, which did not contain manufactured sand.
It must be noted that these are examples only. The use of manufactured sand from different sources and/or in different amounts will have different effects on pumping pressure, and the V-MAR® 3 requirements will also vary. Tests must be conducted on the various mix designs, replacement amounts of manufactured sand, and dosage rates of V-MAR® 3 before the start of a project. An improper mix design, although pumpable, may still be harsh and difficult to place.
Example 1 – Portland Cement Concrete (SI Units)
| Manufactured Sand Content | 0% | 40% | 40% | 60% | 60% |
| Cement, kg/m3 | 274 | 282 | 272 | 275 | 271 |
| Stone, kg/m3 | 964 | 979 | 957 | 946 | 955 |
| Total Sand, kg/m3 | 883 | 905 | 914 | 921 | 907 |
| Total Mix Water, kg/m3 | 196 | 201 | 201 | 206 | 201 |
| WR Admixture, mL/100 kg | 190 | 190 | 190 | 190 | 190 |
| V-MAR 3, mL/100 kg | — | — | 185 | — | 185 |
| Slump, mm | 114 | 95 | 127 | 114 | 127 |
| Air, % | 1.1 | 0.8 | 0.8 | 0.8 | 0.8 |
| Pump Pressure, MPa | 6.5 | 7.6 | 6.5 | 10.9 | 4.8 |
Example 1 – Portland Cement Concrete (English Units)
| Manufactured Sand Content | 0% | 40% | 40% | 60% | 60% |
| Cement, lb/yd3 | 462 | 475 | 459 | 464 | 457 |
| Stone, lb/yd3 | 1625 | 1651 | 1613 | 1594 | 1611 |
| Total Sand, lb/yd3 | 1488 | 1526 | 1542 | 1553 | 1530 |
| Total Mix Water, lb/yd3 | 330 | 338 | 340 | 347 | 339 |
| WR Admixture, oz/cwt | 3 | 3 | 3 | 3 | 3 |
| V-MAR 3, oz/cwt | — | — | 2.8 | — | 2.8 |
| Slump, in. | 4.50 | 3.75 | 5.00 | 4.50 | 5.00 |
| Air, % | 1.1 | 0.8 | 0.8 | 0.8 | 0.8 |
| Pump Pressure, lb/in.2 | 950 | 1100 | 950 | 1580 | 700 |
Example 2 – Portland Cement/Fly Ash Concrete (SI Units)
| Manufactured Sand Content | 0% | 40% | 40% | 60% | 60% | 80%* | 80%* |
| Cement, kg/m3 | 248 | 248 | 252 | 253 | 243 | 246 | 244 |
| Fly Ash, kg/m3 | 65 | 65 | 66 | 66 | 64 | 66 | 64 |
| Stone, kg/m3 | 967 | 968 | 970 | 939 | 926 | 917 | 922 |
| Total Sand, kg/m3 | 887 | 899 | 880 | 926 | 926 | 931 | 935 |
| Total Mix Water, kg/m3 | 178 | 181 | 180 | 177 | 182 | 180 | 186 |
| WR Admixture, mL/100 kg | 260 | 260 | 260 | 260 | 260 | 260 | 260 |
| V-MAR® 3, mL/100 kg | — | — | 165 | — | 165 | — | 165 |
| Slump, mm | 127 | 115 | 140 | 127 | 127 | 115 | 115 |
| Air, % | 1.1 | 0.8 | 0.9 | 1.3 | 0.9 | 0.8 | 0.8 |
| Pump Pressure, MPa | 7.6 | 8.6 | 7.6 | 9.0 | 7.6 | 19.3 | 7.9 |
Example 2 – Portland Cement/Fly Ash Concrete (English Units)
| Manufactured Sand Content | 0% | 40% | 40% | 60% | 60% | 80%* | 80%* |
| Cement, lb/yd3 | 417 | 418 | 425 | 427 | 410 | 415 | 411 |
| Fly Ash, lb/yd3 | 110 | 110 | 111 | 111 | 108 | 111 | 108 |
| Stone, lb/yd3 | 1630 | 1632 | 1636 | 1583 | 1562 | 1547 | 1555 |
| Total Sand, lb/yd3 | 1496 | 1515 | 1483 | 1560 | 1562 | 1570 | 1577 |
| Total Mix Water, lb/yd3 | 300 | 305 | 303 | 298 | 306 | 304 | 313 |
| WR Admixture, oz/cwt | 4 | 4 | 4 | 4 | 4 | 4 | 4 |
| V-MAR® 3, oz/cwt | — | — | 2.5 | — | 2.5 | — | 2.5 |
| Slump, in. | 5.0 | 4.5 | 5.5 | 5.0 | 5.0 | 4.5 | 4.5 |
| Air, % | 1.1 | 0.8 | 0.9 | 1.3 | 0.9 | 0.8 | 0.8 |
| Pump Pressure, MPa | 1100 | 1250 | 1100 | 1300 | 1100 | 2800 | 1150 |
* In the extreme case of using 80% manufactured sand in these lean mixes, the untreated concrete segregated during the pumping process, and pump pressures rose to
unsustainable levels. However, even though the use of V-MAR® 3 reduced the pump pressure to “normal” levels, and the concrete was placeable, it remained more difficult to place than the control mix.
Conclusion
The use of V-MAR® 3 in pumped concretes incorporating different levels of manufactured sand reduced the resultant pumping pressures back to the same level as the control concrete, which did not contain manufactured sand.
Since V-MAR® 3 is treating the free water in the mix and not the cement (as most concrete admixtures do), dosage rates were originally quoted based on the free water in the concrete. Although accurate, this nomenclature has proved confusing to those used to the more familiar dosage units for admixtures. Thus, typical V-MAR® 3 dosages required for pumping applications are found in the range of 1.95 - 3.90 mL/L (¼ - ½ fl oz/gal) of water in the concrete, or 96 - 160 mL/100 kg (1½ - 2½ fl oz/100 lbs) of cementitious materials.
gcpat.com | North America Customer Service: +1 (877) 423 6491
We hope the information here will be helpful. It is based on data and knowledge considered to be true and accurate and is offered for consideration, investigation and verification by the user, but we do not warrant the results to be obtained. Please read all statements, recommendations and suggestions in conjunction with our conditions of sale, which apply to all goods supplied by us. No statement, recommendation, or suggestion is intended for any use that would infringe any patent, copyright, or other third party right.
V-MAR and STRUX are trademarks, which may be registered in the United States and/or other countries, of GCP Applied Technologies Inc. This trademark list has been compiled using available published information as of the publication date and may not accurately reflect current trademark ownership or status. This product may be covered by patents or patents pending.
© Copyright 2018 GCP Applied Technologies Inc. All rights reserved.
.
In Canada, 294 Clements Road, West, Ajax, Ontario, Canada L1S 3C6.
GCP Applied Technologies Inc., 2325 Lakeview Parkway, Suite 400, Alpharetta, GA 30009, USA
GCP Canada, Inc., 294 Clements Road, West, Ajax, Ontario, Canada L1S 3C6
This document is only current as of the last updated date stated below and is valid only for use in the United States. It is important that you always refer to the currently available information at the URL below to provide the most current product information at the time of use. Additional literature such as Contractor Manuals, Technical Bulletins, Detail Drawings and detailing recommendations and other relevant documents are also available on www.gcpat.com. Information found on other websites must not be relied upon, as they may not be up-to-date or applicable to the conditions in your location and we do not accept any responsibility for their content. If there are any conflicts or if you need more information, please contact GCP Customer Service.
Last Updated: 2024-06-21
https://gcpat.com/en/solutions/products/v-mar-admixtures/tb-1402-using-v-mar-3-rheology-modifying-admixture-reduce