Introduction
FORCE 10,000® D, a microsilica-based concrete admixture from GCP Applied Technologies, has gained acceptance in a number of diverse applications. These include environments which are highly corrosive, chemically saturated, or very abrasive and where less-permeable, more-durable concrete is required. In addition, FORCE 10,000® D is being utilized in structural members requiring concrete with improved mechanical properties. This includes ready-mix concrete for columns and beams for high-rise construction and for prestressed girders and piles.
This technical bulletin will discuss the influence of microsilica on some of the principal mechanical properties of importance to design engineers. Some of these are increased compressive strength, modulus of elasticity, flexural strength (modulus of rupture), split tensile, shrinkage, and creep.
Test Data
Data for this bulletin was obtained from various sources. GCP Applied Technologies ran a multitude of laboratory and field tests with the results incorporated here. Other data was taken from published literature and is referenced. Wiss, Janney, Elstner Associates (WJE), Irving, Texas was contracted to run mechanical property tests for concrete with various microsilica dosage rates. The standard reference mixes listed with the WJE test results were developed at GCP. Tests were made with either a liquid-slurry microsilica product or a dry-densified product.
Compressive Strength
Compressive strength is the primary performance measure of concrete and is a property which microsilica strongly benefits. To better understand the contribution of microsilica to high strength concrete versus that of other standard mix ingredients, GCP studied the strength contributions in psi per pound (MPa per kilogram) of cement, classes C and F fly ashes, and microsilica. These are summarized in Figure 1. The values are an average from many different mix designs and microsilica dosage rates.
Pound per pound (kg per kg), microsilica is significantly more efficient in compressive strength development than both cement and fly ash. At 28 days, microsilica can be almost 5 times more effective than cement in contributing to compressive strength. This is a result of both the pozzolanic nature and fineness of the microsilica, which are described in detail in Technical Bulletin TB-0709.
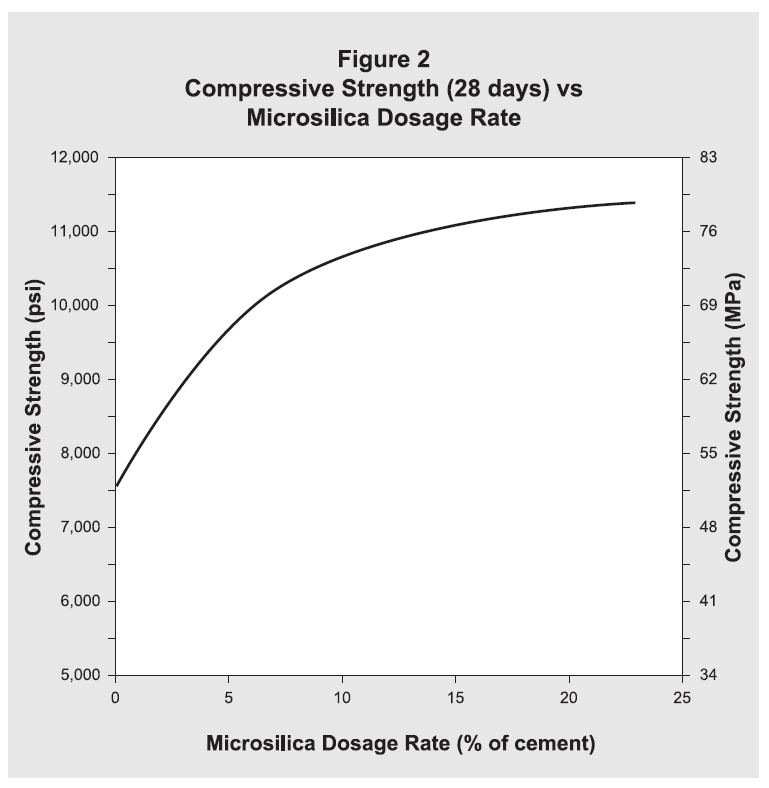
Figure 2 shows how microsilica influences the compressive strength of concrete at 28 days. Table 1 gives the concrete mix design which corresponds to the results in Figures 1 and 2. Concrete with 5% or 10% microsilica content exhibits good strength gains and even 15% dosages provide additional benefits, although the added benefit for the incremental 5% addition is less.
Figure 1
Figure 2
Despite increased nominal strength at dosages in excess of 20%, the compressive strength contribution is lower than in the 5% to 15% dosage range. Therefore, for high-strength applications, microsilica dosages are typically 15% or less. Table 2 gives the concrete mix designs and compressive strength results from the addition of 5%, 10% and 15% microsilica in the WJE study. All compressive strength tests were run according to ASTM C39.
Because of microsilica’s exceptional strength contribution, concrete compressive strengths in excess of 10,000 psi (69 MPa) are easily and routinely available with FORCE 10,000® D. For two major high-rise projects in Seattle1, ready-mixed microsilica concrete consistently produced 19,000 psi (131 MPa) at 56 days (56 or 90-day compressive strengths are typically specified for high-strength concrete).
It should be noted from Table 2, that high strength concrete may be produced without microsilica. However, with microsilica it can be mass produced on a more consistent basis and with greater workability.
Modulus of Elasticity
As tested according to ASTM C469, the modulus of elasticity, or slope of the stress-strain curve increases proportionally for high strength concrete. This is used for determining deformation and stiffness of a structure. For high-rise buildings, the stiffer the structure, the less it sways and drifts, increasing safety factors and the comfort level for occupants on higher floors. For a recently-constructed 56-story building in Seattle, column stiffness was of extreme importance. By going to a higher-strength, stiffer concrete, designers were able to use ten-foot diameter core columns occupying only sixty percent of the area which would have been required by normal-strength columns. This resulted in a significant increase in usable floor space, considerable construction cost savings and a stiffer structure.
Table 1
Concrete Mix Designs used in Figures 1 and 2
| Concrete Material | Figure 1 | Figure 2 |
| Cement, lb/yd3 (kg/m3) |
500-800 (297-475) |
700 (415) |
| Coarse Aggregate, lb/yd3 (kg/m3) |
1,610–1,710 (955-1,015) |
1,720 (1,020) |
| Fine Aggregate, lb/yd3 (kg/m3) |
1,060-1,325 (629–786) |
1,060 (629) |
| Water/cement ratio | 0.40 | 0.40 |
| Fly ash, lb/yd3 (kg/m3) | 0–140 (0–83) | 0 |
| Microsilica, % of cement | 0 - 20 | 0 - 22.5 |
| Air content, % | 1.5 | 1.5 |
| Admixtures added for workability |
Table 2
Wiss, Janney Elstner Mechanical Properties Study Concrete Mix Designs
| Reference Mixes | Mix A | Mix B | Mix C | ||
| Similar Mix Design | Similar Strength | ||||
| Cement, Type I, lb/yd3 (kg/m3) | 700 (415) | 850 (504) | 691 (410) | 696 (413) | 694 (412) |
| Fly ash, Type C, lb/yd3 (kg/m3) | — | — | — | 149 (88) | — |
| Coarse aggregate, lb/yd3 (kg/m3) | 1,850 (1,098) | 1,775 (1,053) | 1,842 (1,093) | 1,857 (1,102) | 1,852 (1,099) |
| Fine aggregate, lb/yd3 (kg/m3) | 1,400 (831) | 1,325 (786) | 1,356 (805) | 1,174 (697) | 1,280 (759) |
| Microsilica, lb/yd3 (kg/m3) % by wt. of cement |
0 (0) 0 |
0 (0) 0 |
32 (19) 4.6 |
66 (39) 9.4 |
100 (59) 14.4 |
| Water/cement ratio | 0.35 | 0.30 | 0.35 | 0.35 | 0.35 |
| DARACEM® 100, oz/cwt (mL/100 kg) | 18 (1,174) | 26 (1,695) | 18 (1,174) | 18 (1,174) | 18 (1,174) |
| Air content, % | 1.5 | 1.6 | 2.4 | 1.9 | 2.0 |
| Test Results (28 Days) | |||||
| Reference Mixes | Mix A | Mix B | Mix C | ||
| Similar Mix Design | Similar Strength | ||||
| Compressive strength, psi (MPa) |
6,500–7,500 (45–52) |
11,000 (76) |
9,860 (68) |
11,600 (80) |
11,310 (78) |
| Modulus of elasticity, psi x 106 (MPa x 104) |
4.5 – 5.1 (3.1 – 3.5) |
5.7 – 6.0 (3.9 – 4.1) |
6.09 (4.2) |
6.37 (4.4) |
6.25 (4.3) |
| Poisson’s ratio | 0.20 | 0.20 | 0.20 | 0.21 | 0.20 |
| Flexural strength, psi (MPa) |
650 – 950 (4.5 – 6.6) |
1,200 – 1,300 (8.3 – 9.0) |
1,295 (8.9) |
1,525 (10.5) |
1530 (10.5) |
| Splitting tensile strength, psi (MPa) |
550 – 650 (3.8 – 4.5) |
650 – 800 (4.5 – 5.5) |
750 (5.2) |
760 (5.2) |
690 (4.8) |
| Length change at one year (µin./in.) | (-400 to -600) | (-500 to -700) | (-387) | (-365) | (-458) |
| Unit creep at two years (µin./in./psi) | (0.35 to 0.50) | (0.25 to 0.50) | (0.15) | — | — |
Notes: All weights in pounds per cubic yard of concrete. Reference Mixes by GCP and WJE for comparison. Similar Strength Reference Mixes were performed under laboratory conditions.
The modulus of elasticity of concrete is dependent upon the modulus of both the paste and aggregates and their relative amounts in the mix. Typically, the modulus of normal paste ranges from 2.5 to 3.5 million psi (.017 to .024 million MPa), whereas moduli for aggregates are significantly higher. Stress differential occurs at the paste-aggregate bond, and values for the resultant concrete moduli can be in the 3 to 5 million psi (.021 to .034 million MPa) range for normal strength concrete. With microsilica pastes, the modulus of concrete can be increased to ranges of 5 to 7 million psi (.034 to .048 million MPa), approaching that of some aggregates. The mix then behaves as if it were homogeneous, the stress differential between paste and aggregate is decreased, and the overall concrete modulus of elasticity can average 6 million psi (.04 million MPa) and more.concrete, designers were able to use ten-foot diameter core columns occupying only sixty percent of the area which would have been required by normal-strength columns. This resulted in a significant increase in usable floor space, considerable construction cost savings and a stiffer structure.
For three different concrete mixes run by WJE, the modulus at 28 days ranged from 6.1 to 6.4 million psi (.042 to .044 million MPa) as summarized in Table 2. These are values for 9,700 to 11,600 million psi (66.8 to 79.9 million MPa) compressive strength concrete. For higher strength concrete, such as for the Seattle projects referenced earlier, the modulus of elasticity was typically 6.8 to 7.2 million psi (.047 to .050 million MPa) at 56 days.
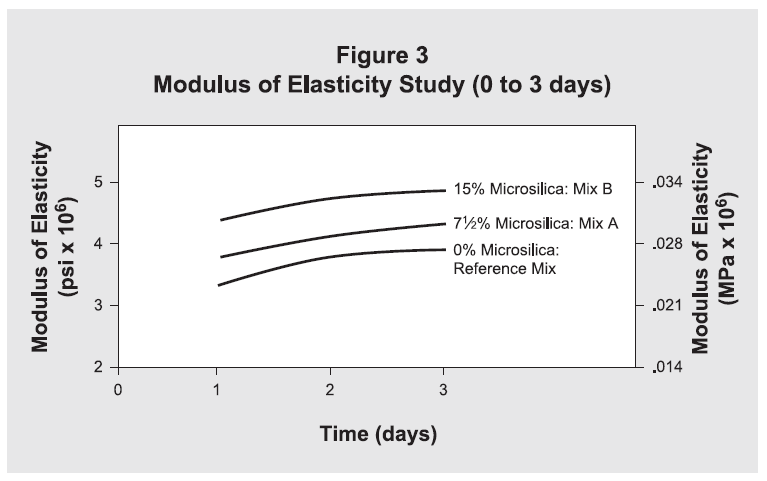
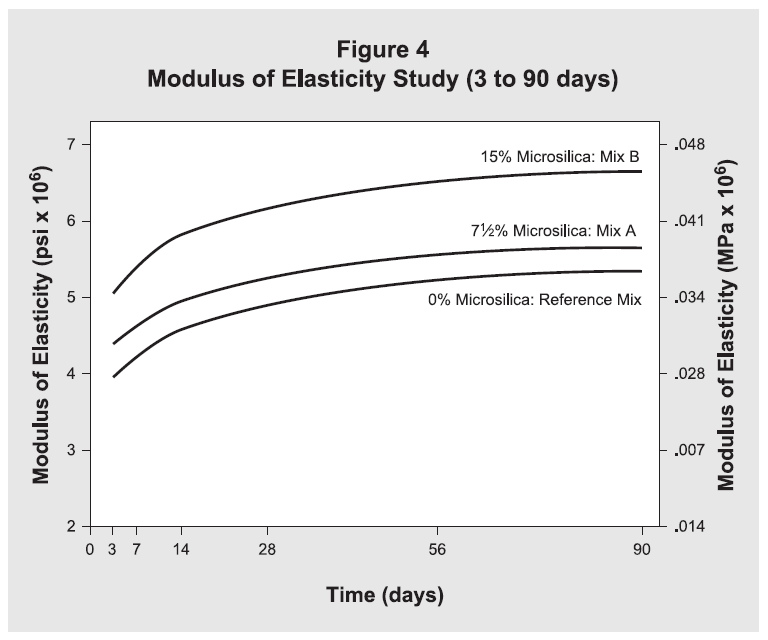
A study was conducted at the GCP laboratory2 to measure modulus of elasticity for various dosage rates of microsilica and cement factors. Table 3 lists these mix designs. Figure 3 shows the modulus of elasticity for the first three days while Figure 4 shows the values at three to ninety days.
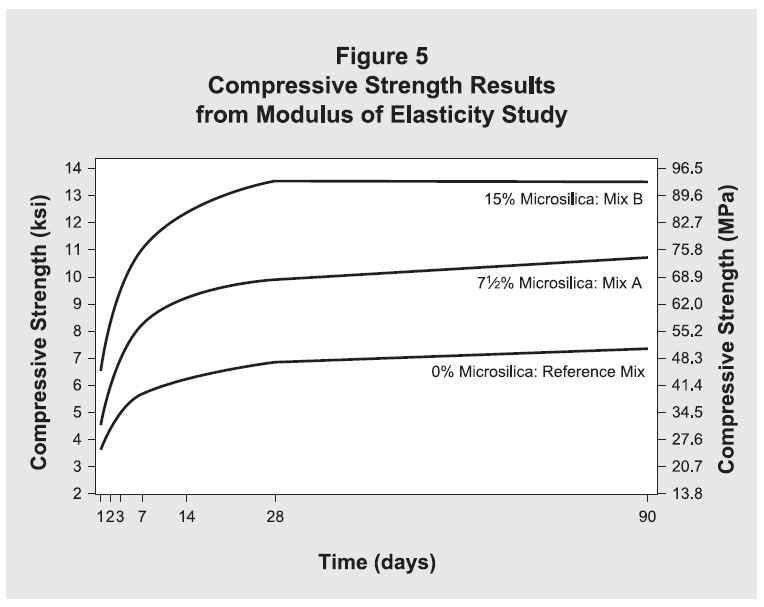
Figure 5 shows the corresponding compressive strength curves. These figures show that higher-strength concretes produce greater modulus of elasticity values which help reduce deflection in columns and beams.
Although a greater modulus of elasticity indicates a more brittle material, this is easily corrected through the use of additional reinforcement for high-strength concrete design. The benefits of higher strength concrete and a stiffer structure outweigh any inconvenience. This does not mean, however, that a large increase in compressive strength represents a corresponding large increase in modulus of elasticity. In fact from the GCP study, 28-day compressive strengths for the Reference Mix was 7,400 psi (51.0 MPa) and the 71/2% microsilica mix 10,500 psi (72.3 MPa) while corresponding moduli of elasticity were 4.9 x 10⁶ and 5.2 x 10⁶ psi (.034 x .73 and .036 x .73 MPa) respectively (Figure 4). Concretes of similar compressive strength, with or without microsilica, exhibit moduli of elasticity which are similar as shown in Table 2.
Poisson’s Ratio
In the study performed by WJE on FORCE 10,000® D concrete, Poisson’s ratio, the ratio of strain in the lateral direction to strain in the vertical direction, averaged between 0.20 and 0.21 for all three mixes. This value is in line with normal strength concrete.
Table 3
Modulus of Elasticity Study Concrete Mix Designs
| Reference Mix | Mix A | Mix B | |
| Cement, Type 1 lb/yd3 (kg/m3) |
658 (390) |
658 (390) |
752 (446) |
| Coarse Aggregate, lb/yd3 (kg/m3) |
1,800 (1,068) |
1,800 (1,068) |
1,800 (1,068) |
| Fine Aggregate, lb/yd3 (kg/m3) |
1,336 (793) |
1,278 (758) |
1,148 (681) |
| Microsilica (Force 10,000® D) — lb/yd3 (kg/m3) — % of cement |
0 0 |
49 (29) 7.5 |
113 (67) 15.0 |
| Water/cement ratio | 0.40 | 0.40 | 0.35 |
| DARACEM® 19, oz/cwt (mL/100 kg) |
12 (782) |
18 (1,174) |
20 (1,304) |
| Air content, % | 1.5 | 1.5 | 2.3 |
Figure 3
Figure 4
Flexural Strength (Modulus of Rupture)
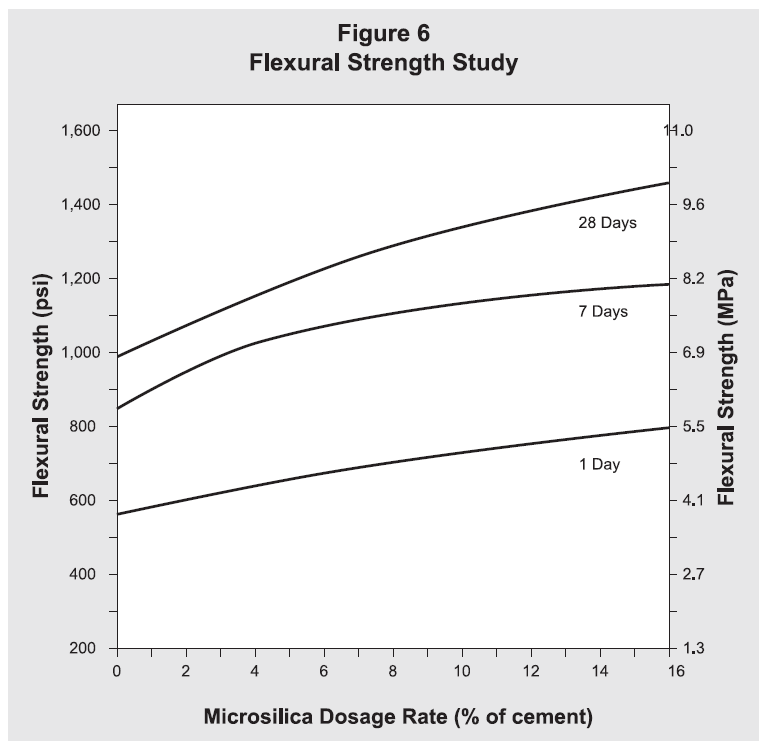
The flexural strength, or modulus of rupture, as measured by ASTM C78, becomes an important material parameter in airport and roadway paving applications, in building floors or roof decks and in pavement repair and bonded overlays where flexural failure is more probable than failure in compression. Since flexural strength of the aggregate is usually significantly greater than that of the paste, it becomes extremely important to have good paste-to-aggregate bonding which ties the aggregate together. Because FORCE 10,000® D paste provides excellent bonding to the aggregate, the concrete flexural strengths are greatly improved. Flexural values of 800 psi (5.5 MPa) in 24 hours have been achieved with FORCE 10,000® D, with 28 day values in excess of 1,500 psi (10.3 MPa). The WJE 28-day results were 1,295 psi (8.9 MPa) for 5% microsilica, 1,525 psi (10.5 MPa) for 10% microsilica plus fly ash, and 1,530 psi (10.6 MPa) for 15% microsilica (Table 2). Concrete with microsilica produces greater flexural strengths than similar compressive strength concrete without microsilica (Table 2).
In another GCP laboratory study3, flexural strengths were measured at 1, 7 and 28 days for concrete containing 0%, 5%, 10% and 15% microsilica. Table 4 lists the concrete mix designs used. Figure 6 gives the flexural strength results from this study and Figure 7 the compressive strength results.
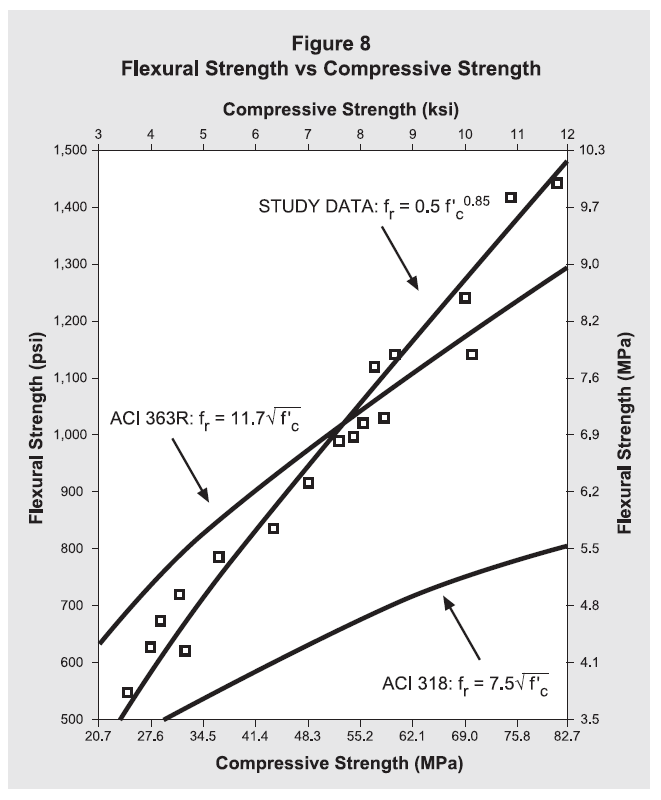
ACI 318 recommends using the equation: 7.5√ f’c for estimating concrete flexural strength for design purposes when testing is not available. For FORCE 10,000® D concrete, studies by GCP and WJE have shown that flexural strength results were over 50% greater than the ACI formula prediction. This is attributed in part to the better paste to aggregate bond developed by microsilica concrete, and in part to the conservative nature of the ACI 318 equation.
Data presented in the ACI 363R State of the Art Report on High Strength Concrete4 show that the ACI 318 equation seriously understates the flexural strength of high-strength concrete. The relationship is more accurately represented by: fr = 11.7√ f’c. The GCP data compare favorably to the ACI 363R equation but better fit the following: fr = 0.5√ f’c0.85. This equation predicts somewhat higher flexural strength at high compressive strengths than does the ACI 363R equation. The GCP data and all of these formulas are shown in Figure 8.
Split Tensile
Split tensile strengths as measured by ASTM C496 are important in design considerations when assurances of adequate concrete shear strength is required. In general it is a measure of concrete quality. Values for the WJE test are shown in Table 2.
Length Change
Two types of shrinkage cracking are well-known in concrete: plastic and drying shrinkage. Plastic shrinkage typically occurs during the first twelve hours after placement, and is due to a rapid drying of the concrete surface. Since concrete which contains 5% and higher microsilica dosage rate bleeds less in slabs than normal concrete, it is important to maintain an adequate surface moisture level with fog misting and moist curing during this critical time period. Following good curing practices as outlined in ACI guidelines will alleviate most plastic shrinkage cracking.
Figure 5
Table 4
Flexural Strength Study Concrete Mix Designs
| Reference Mixes | Mix A | Mix B | Mix C | |
| Cement, Type 1 lb/yd3 (kg/m3) |
658 |
658 (390) |
658 (390) |
658 (390) |
| Coarse Aggregate, lb/yd3 (kg/m3) |
1,800 (1,068) |
1,800 (1,068) |
1,800 (1,068) |
1,800 (1,068) |
| Fine Aggregate, lb/yd3 (kg/m3) |
1,358 (806) |
1,320 (783) |
1,278 (758) |
1,221 (724) |
| Microsilica (Force 10,000® D) — lb/yd3 (kg/m3) — % of cement |
0 0 |
33 (20) 5.0 |
66 (39) 10.0 |
99 (59) 15.0 |
| Water/cement ratio | 0.40 | 0.40 | 0.40 | 0.40 |
| DARACEM® 19, oz/cwt (mL/100 kg) |
12 (782) |
18 (1,174) |
18 (1,174) |
18 (1,174) |
| Air content, % | 1.5 | 1.5 | 1.5 | 1.4 |
Figure 6
the stiffness and maximum size of the aggregate. Tests were performed according to ASTM C157 with results at one year from the WJE report shown in Table 2. The microsilica concrete shrinkage values are less than concrete without microsilica at one year. practices as outlined in ACI guidelines will alleviate
Creep
The WJE study tested for concrete creep according to ASTM C512. Creep is the measure of axial deformation of a material under continuous load. The two-year creep value for the 5% microsilica concrete mix is shown in Table 2. This value is considered better than normal-strength concrete.
Conclusion
Concrete compressive strengths have been climbing higher over recent years. The addition of microsilica has resulted in a quantum leap to even higher strengths and increases in all other mechanical properties of concrete. These increased values will allow the structural engineer to design concrete structures today which were only a dream yesterday.
References
- Godfrey, Jr., K. A.; Concrete Strength Record Jumps 36%, Civil Engineering, October 1987.
- Dallaire, M. P. and Berke, N. S.; Modulus of Elasticity Study of FORCE 10,000® D Concrete, Unpublished, June 1989.
- Dallaire, M. P. and Berke, N. S.; Flexural Strength Study of FORCE 10,000® D Concrete, Unpublished, April 1989.
- State-of-the-Art Report on High Strength Concrete, ACI 363.
Figure 7
Figure 8
gcpat.com | North America Customer Service: +1 (877) 423 6491
We hope the information here will be helpful. It is based on data and knowledge considered to be true and accurate and is offered for consideration, investigation and verification by the user, but we do not warrant the results to be obtained. Please read all statements, recommendations and suggestions in conjunction with our conditions of sale, which apply to all goods supplied by us. No statement, recommendation, or suggestion is intended for any use that would infringe any patent, copyright, or other third party right.
GCP, GCP Applied Technologies, FORCE 10,000 D and DARACEM are trademarks, which may be registered in the United States and/or other countries, of GCP Applied Technologies Inc. This trademark list has been compiled using available published information as of the publication date and may not accurately reflect current trademark ownership or status.
© Copyright 2019 GCP Applied Technologies Inc. All rights reserved.
.
In Canada, 294 Clements Road, West, Ajax, Ontario, Canada L1S 3C6.
GCP0083 TB-0713-0417
GCP Applied Technologies Inc., 2325 Lakeview Parkway, Suite 475, Alpharetta, GA 30009, USA
GCP Canada, Inc., 294 Clements Road, West, Ajax, Ontario, Canada L1S 3C6
This document is only current as of the last updated date stated below and is valid only for use in the United States. It is important that you always refer to the currently available information at the URL below to provide the most current product information at the time of use. Additional literature such as Contractor Manuals, Technical Bulletins, Detail Drawings and detailing recommendations and other relevant documents are also available on www.gcpat.com. Information found on other websites must not be relied upon, as they may not be up-to-date or applicable to the conditions in your location and we do not accept any responsibility for their content. If there are any conflicts or if you need more information, please contact GCP Customer Service.
Last Updated: 2024-06-21
https://gcpat.com/en/solutions/products/force-10000-d-silica-fume/tb-0713-mechanical-properties-force-10000-d

